Explore a plant
Replace the text in square brackets with your Plant and dates.
1. Find the Plant
Find [Plant name]. Show its code, timezone, and current status.
The assistant searches by Plant name or code. It cannot search by city.
2. Choose a complete date window
Show daily yield, PR, availability, and irradiation at [Plant name] from [start date] to [end date]. State the timezone.
Use an explicit date range and complete days. The assistant uses the Plant time zone.
3. Investigate an unusual result
Show daily performance at [Plant name] from [start date] to [end date]. Which day has the lowest PR? Show the yield, availability, and irradiation of that day.
Ask the assistant to keep the Plant, date window, time zone, and coverage next to the result.
See a chart in the chat
Ask for one day of power, yield, or performance as a chart:
Show the power chart for [Plant name] yesterday.
AI tools that support MCP Apps show the chart in the conversation. Hover to read a value. Zoom into part of the day. The time axis uses the Plant time.
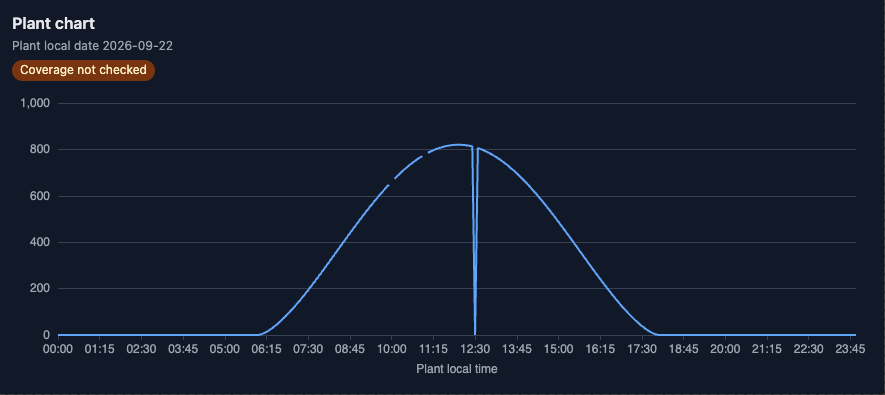
SolarSENS can fill a missing value with 0 or with the previous value. A gap in the line shows only a missing timestamp. A "Coverage not checked" badge means the service did not check that day for missing data. An AI tool that cannot show charts gets the same values as text.
Review performance
Ask whether the performance ratio (PR) of one Plant on one day is below its recent range:
Is the daily PR at [Plant name] on [date] below its range for the 7 days before? Show the values that you compared.
The review compares the day with the 7 days before it. A low PR is a measured gap. The answer gives possible causes, not a confirmed cause. See Guided checks. Below, D is the day of the review.
Not checked: work orders, DataHub, status as of D, device fault history.
Read only when you ask: alarm history, sub-day window.Compare Plants
Compare yesterday's yield and PR at [Plant name] and [Plant name]. Keep a missing value separate from zero.